canvas 標籤是HTML5裡最早導入的,其本身並不是圖像,而是繪制圖片的區域
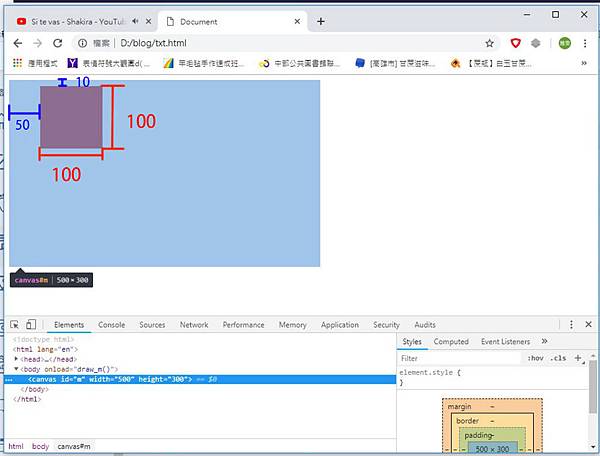
繪製方形
原始碼:
<!DOCTYPE html>
<html lang="en">
<head>
<meta charset="UTF-8">
<meta name="viewport" content="width=device-width, initial-scale=1.0">
<meta http-equiv="X-UA-Compatible" content="ie=edge">
<title>測試</title>
<script>
function draw_m(){
var m_canvas=document.getElementById("m");
var m_ctx=m_canvas.getContext("2d");
m_ctx.fillStyle="rgb(200,0,0)";
m_ctx.fillRect (50,10,100,100);
}
</script>
</head>
<body onload="draw_m()">
<canvas id="m" width="500" height="300"></canvas>
</body>
</html>
說明:
function draw_m(){ 定義繪圖函數,函數名稱可何用任何名稱,但限英數及底線,不可有空白。且第一個字需以英文字開頭
var m_canvas=document.getElementById("m"); 使用此方法呼叫出物件,並儲存於 m_canvas 變數中
var m_ctx=m_canvas.getContext("2d"); 使用ctx變數來執行繪圖指令,並使用getContext來獲得2D的context。目前只有2D繪圖
m_ctx.fillStyle="rgb(200,0,0)"; 指定圖型的CSS樣式,可使用 rgb(R,G,B) 或 rgb(R,G,B,alpha)
m_ctx.fillRect (50,10,100,100); 為了畫出四方形使用 fillRect 方法,其基本形式為 fillRect (x,y,width,height),fillRect與刮號間需空白
<body onload="draw_m()"> 一開啟頁面時 馬上載入執行 draw_m 函數
原始碼:
<!DOCTYPE html>
<html lang="en">
<head>
<meta charset="UTF-8">
<meta name="viewport" content="width=device-width, initial-scale=1.0">
<meta http-equiv="X-UA-Compatible" content="ie=edge">
<title>Document</title>
<script>
function draw_m(){
var m_canvas=document.getElementById("m");
var m_ctx=m_canvas.getContext("2d");
m_ctx.fillStyle="rgb(200,0,0)";
m_ctx.fillRect (10,10,100,100);
m_ctx.fillStyle="rgb(0,0,200)";
m_ctx.fillRect (50,50,100,100);
m_ctx.clearRect (60,60,40,40);
m_ctx.strokeStyle="rgb(200,0,250)";
m_ctx.strokeRect (200,50,70,150);
}
</script>
</head>
<body onload="draw_m()">
<canvas id="m" width="500" height="300"></canvas>
</body>
</html>
輸出畫面:
說明:
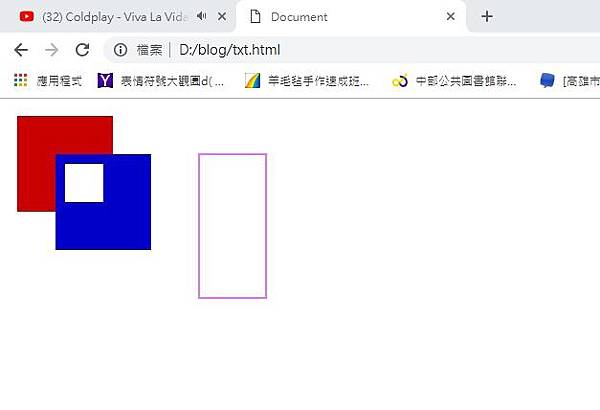
m_ctx.fillStyle="rgb(200,0,0)"; 填上紅色方形,也可以改寫成 m_ctx.fillStyle="#c80000";,或搭配 raga 方式
m_ctx.fillStyle="rgb(0,0,200)"; 填上藍色
m_ctx.clearRect (60,60,40,40); 清除以(60,60) 為起點的 40X40大小之方形
m_ctx.strokeStyle="rgb(200,0,250)"; 填上桃色長方形邊,也可以改寫成 m_ctx.strokeStyle="#c800fa";
繪製三角形
原始碼:
<!DOCTYPE html>
<html lang="en">
<head>
<meta charset="UTF-8">
<meta name="viewport" content="width=device-width, initial-scale=1.0">
<meta http-equiv="X-UA-Compatible" content="ie=edge">
<title>Document</title>
<script>
function draw_m(){
var m_canvas=document.getElementById("m");
var m_ctx=m_canvas.getContext("2d");
m_ctx.beginPath();
m_ctx.moveTo(50,50);
m_ctx.lineTo(150,50);
m_ctx.lineTo(50,150);
m_ctx.fill();
}
</script>
</head>
<body onload="draw_m()">
<canvas id="m" width="500" height="300"></canvas>
</body>
</html>
輸出畫面:
說明:
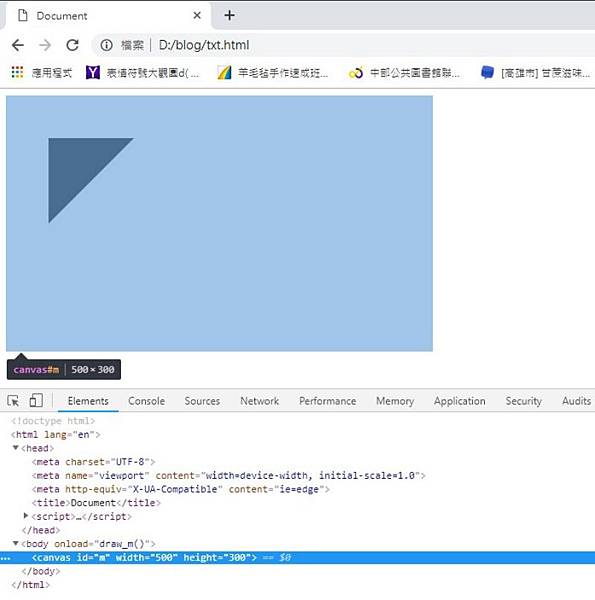
beginPath(); 開始路徑
moveTo(50,50) 畫布一開始做好或執行 beginPath 時,起始點會是在原點(0,0) ,如果路徑不是從原點開始時,就需使用此方法移動起始點的位置
lineTo(150,50) 畫直線的方式,直線的結束端點就是下一條直線的起點
fill() 圖型填色,使用此方法時,原本開放路徑的圖型會自動封閉,在此情況下可以不使用 closeePath() 也可以
原始碼:
<!DOCTYPE html>
<html lang="en">
<head>
<meta charset="UTF-8">
<meta name="viewport" content="width=device-width, initial-scale=1.0">
<meta http-equiv="X-UA-Compatible" content="ie=edge">
<title>Document</title>
<script>
function draw_m(){
var m_canvas=document.getElementById("m");
var m_ctx=m_canvas.getContext("2d");
m_ctx.beginPath();
m_ctx.moveTo(50,50);
m_ctx.lineTo(150,50);
m_ctx.lineTo(50,150);
m_ctx.closePath();
m_ctx.stroke();
}
</script>
</head>
<body onload="draw_m()">
<canvas id="m" width="500" height="300"></canvas>
</body>
</html>
輸出畫面:
說明:
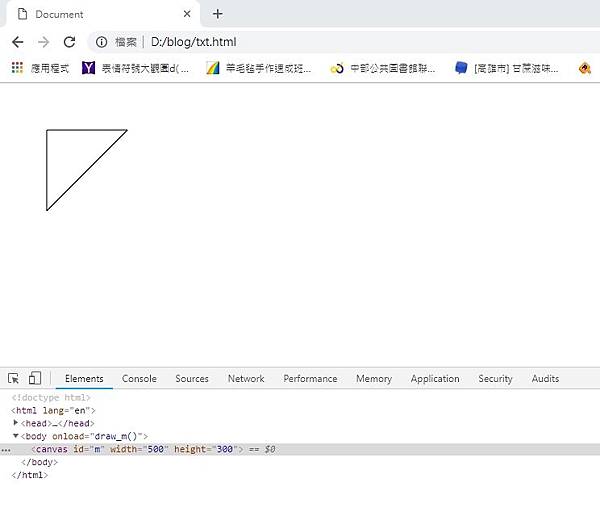
closePath(); 封閉路徑,用此方法用直線連接目前端點及起始點
stroke(); 繪製路徑邊框
原始碼:
<!DOCTYPE html>
<html lang="en">
<head>
<meta charset="UTF-8">
<meta name="viewport" content="width=device-width, initial-scale=1.0">
<meta http-equiv="X-UA-Compatible" content="ie=edge">
<title>Document</title>
<script>
function draw_m(){
var m_canvas=document.getElementById("m");
var m_ctx=m_canvas.getContext("2d");
m_ctx.beginPath();
m_ctx.moveTo(50,50);
m_ctx.lineTo(150,50);
m_ctx.lineTo(50,150);
m_ctx.fill();
m_ctx.beginPath();
m_ctx.moveTo(80,80);
m_ctx.lineTo(200,100);
m_ctx.lineTo(100,200);
m_ctx.closePath();
m_ctx.strokeStyle="rgb(200,0,0)";
m_ctx.stroke();
}
</script>
</head>
<body onload="draw_m()">
<canvas id="m" width="500" height="300"></canvas>
</body>
</html>
輸出畫面:
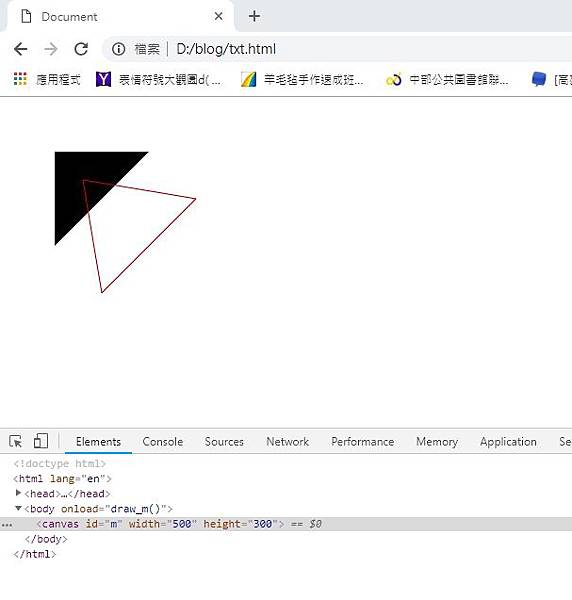
原始碼:
<!DOCTYPE html>
<html lang="en">
<head>
<meta charset="UTF-8">
<meta name="viewport" content="width=device-width, initial-scale=1.0">
<meta http-equiv="X-UA-Compatible" content="ie=edge">
<title>Document</title>
<script>
function draw_m(){
var m_canvas=document.getElementById("m");
var m_ctx=m_canvas.getContext("2d");
m_ctx.beginPath();
//左方斜線
m_ctx.moveTo(50,50);
m_ctx.lineTo(80,80);
//右方斜線
m_ctx.moveTo(140,80);
m_ctx.lineTo(170,50);
//下方平線
m_ctx.moveTo(60,150);
m_ctx.lineTo(170,150);
m_ctx.stroke();
}
</script>
</head>
<body onload="draw_m()">
<canvas id="m" width="500" height="300"></canvas>
</body>
</html>
輸出畫面:
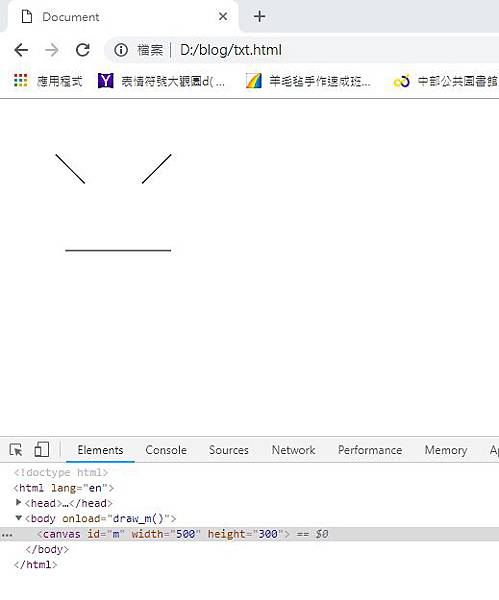
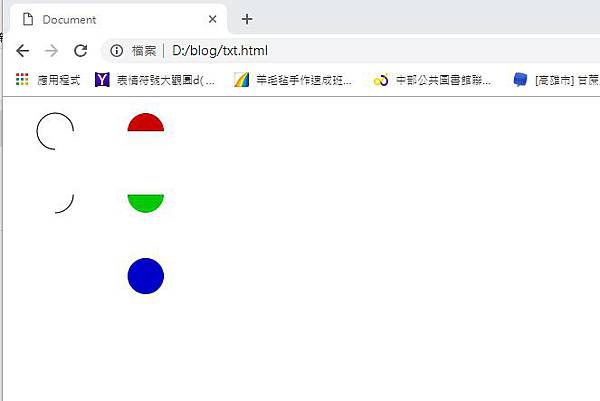
繪製圓 / 圓弧形
繪製圓型或圓弧型是使用 arc 方法,但在 Gecko 系的瀏覽器裡不支援 ( 如: Netscape等 )
arc(x,y,半徑r,圓弧起點角度sratAngle,圓弧終點角度endAngle,繪製方向anticlockwise);
arc方式是以 (x,y) 位置開始以逆時鐘 ( 預設 ) 方向畫出半徑(r) 的圓型
startAngle 及 endAngle 參數是以角度標示圓弧型的起點和終點的部份
anticlockwise 參數繪製圓弧時是否以逆時鐘方向繪製,指定 是 ( true 則逆時鐘) 、 否 ( false 則順時鐘 )
arc方法裡的角度不會以度標記,而是以弳度 (radian) 標記,弳度可參考 這裡
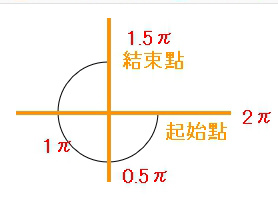
計算方式:
1 π rad = 180°,1°=π/180 rad
所以60度= ( π/180 ) * 60弳度,360度= 2π弳度
把這個計算方式用 Javascript 函數標示,則
var radians = (Math.PI/180)*degrees
程式碼:
<!DOCTYPE html>
<html lang="en">
<head>
<meta charset="UTF-8">
<meta name="viewport" content="width=device-width, initial-scale=1.0">
<meta http-equiv="X-UA-Compatible" content="ie=edge">
<title>Document</title>
<script>
function draw_m(){
var m_canvas=document.getElementById("m");
var m_ctx=m_canvas.getContext("2d");
m_ctx.beginPath();
m_ctx.arc(50,30,20,0,(Math.PI/180)*90,true);
m_ctx.stroke();
m_ctx.beginPath();
m_ctx.arc(50,100,20,0,Math.PI*0.5,true);
m_ctx.stroke();
}
</script>
</head>
<body onload="draw_m()">
<canvas id="m" width="500" height="300"></canvas>
</body>
</html>
輸出畫面
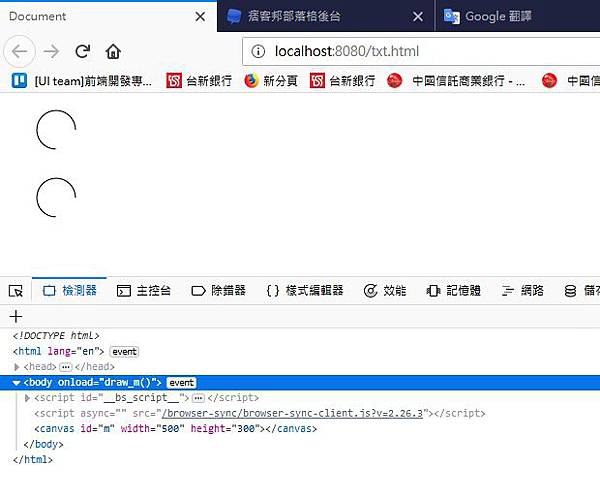
原始碼:
<!DOCTYPE html>
<html lang="en">
<head>
<meta charset="UTF-8">
<meta name="viewport" content="width=device-width, initial-scale=1.0">
<meta http-equiv="X-UA-Compatible" content="ie=edge">
<title>Document</title>
<script>
function draw_m(){
var m_canvas=document.getElementById("m");
var m_ctx=m_canvas.getContext("2d");
//左上
m_ctx.beginPath();
m_ctx.arc(50,30,20,0,(Math.PI/180)*90,true);
m_ctx.stroke();
//左下
m_ctx.beginPath();
m_ctx.arc(50,100,20,0,(Math.PI/180)*90,false);
m_ctx.stroke();
//右上紅半圓
m_ctx.beginPath();
m_ctx.arc(150,30,20,0,Math.PI,true);
m_ctx.fillStyle="rgb(200,0,0)";
m_ctx.fill();
//右中綠半圓
m_ctx.beginPath();
m_ctx.arc(150,100,20,0,(Math.PI/180)*180,false);
m_ctx.fillStyle="rgb(0,200,0)";
m_ctx.fill();
//右下藍圓
m_ctx.beginPath();
m_ctx.arc(150,190,20,0,(Math.PI/180)*360,false);
m_ctx.fillStyle="rgb(0,0,200)";
m_ctx.fill();
}
</script>
</head>
<body onload="draw_m()">
<canvas id="m" width="500" height="300"></canvas>
</body>
</html>
輸出畫面:
繪製貝茲曲線
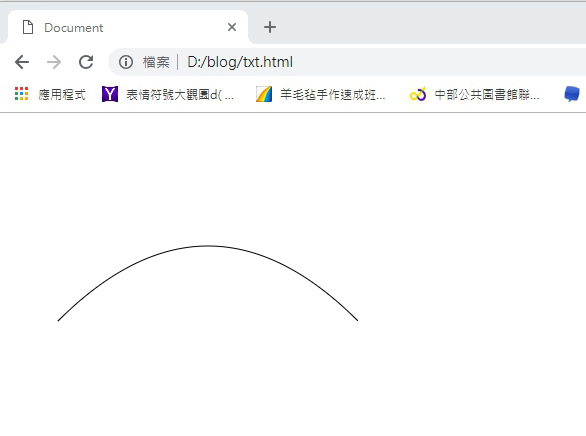
繪製貝茲曲線方法有:
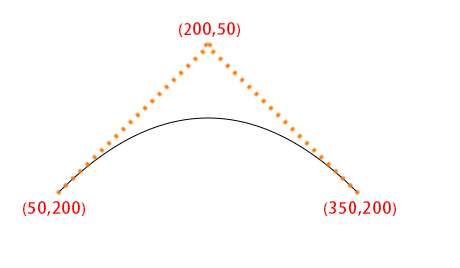
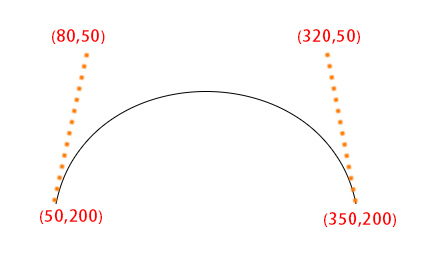
. quadraticCurveTo(cp1x,cp1y,x,y) 一個錨點,使用 (cp1x,cp1y) 畫出到 (x,y) 的曲線
. bezierCurveTo(cp1x,cp1y,cp2x,cp2y,x,y) 二個錨點,也就是說 使用 (cp1x,cp1y) 、(cp2x,cp2y) 畫出到 (x,y) 的曲線
原始碼:
<!DOCTYPE html>
<html lang="en">
<head>
<meta charset="UTF-8">
<meta name="viewport" content="width=device-width, initial-scale=1.0">
<meta http-equiv="X-UA-Compatible" content="ie=edge">
<title>Document</title>
<script>
function draw_m(){
var m_canvas=document.getElementById("m");
var m_ctx=m_canvas.getContext("2d");
m_ctx.beginPath();
m_ctx.moveTo(50,200);
m_ctx.quadraticCurveTo (200,50,350,200);
m_ctx.stroke();
}
</script>
</head>
<body onload="draw_m()">
<canvas id="m" width="500" height="300"></canvas>
</body>
</html>
輸出畫面:
說明:
原始碼:
<!DOCTYPE html>
<html lang="en">
<head>
<meta charset="UTF-8">
<meta name="viewport" content="width=device-width, initial-scale=1.0">
<meta http-equiv="X-UA-Compatible" content="ie=edge">
<title>Document</title>
<script>
function draw_m(){
var m_canvas=document.getElementById("m");
var m_ctx=m_canvas.getContext("2d");
m_ctx.beginPath();
m_ctx.moveTo(50,200);
m_ctx.bezierCurveTo (80,50,320,50,350,200);
m_ctx.stroke();
}
</script>
</head>
<body onload="draw_m()">
<canvas id="m" width="500" height="300"></canvas>
</body>
</html>
輸出畫面:
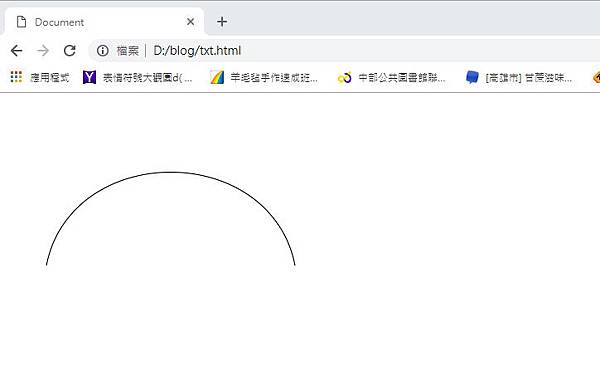
說明:
樣式- 透明度
- .globalAlpha 屬性
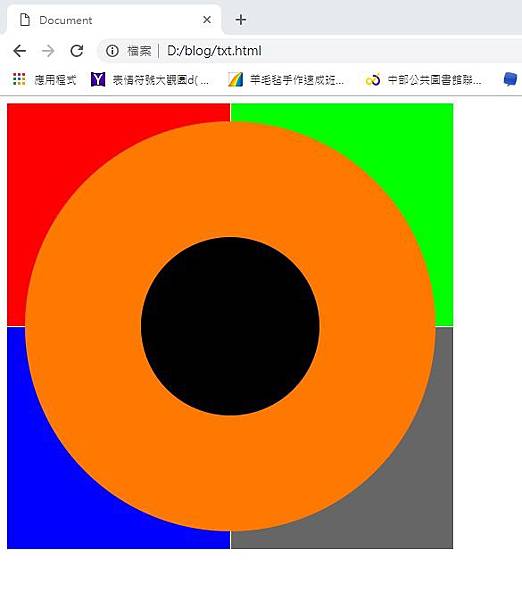
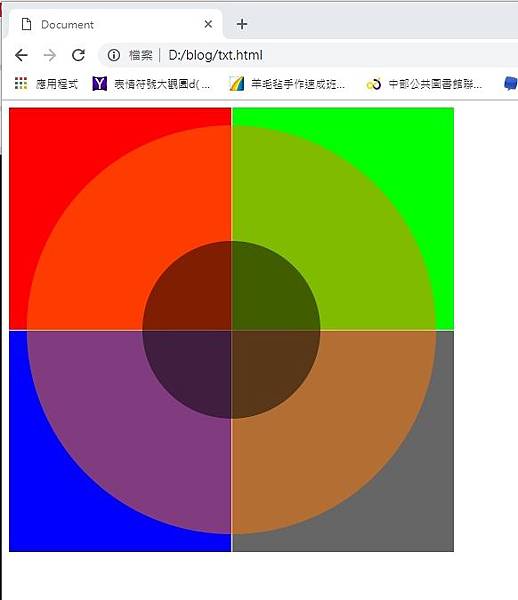
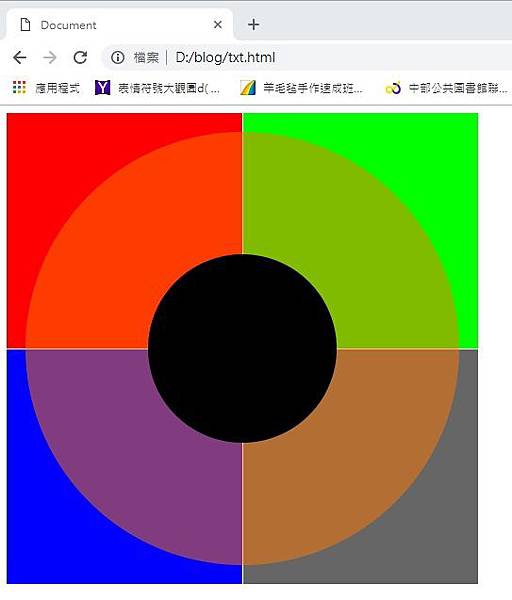
- 如果使用 globalAlpha 屬性,寫於該屬性之後的各種圖形就會套用相同的透明度。可用值從0.0( 完全透明 ) 到 1.0(完全不透明),預設值為 1.0
-
- 原始碼:
-
<!DOCTYPE html>
<html lang="en">
<head>
<meta charset="UTF-8">
<meta name="viewport" content="width=device-width, initial-scale=1.0">
<meta http-equiv="X-UA-Compatible" content="ie=edge">
<title>Document</title>
<script>
function draw_m() {
var m_canvas = document.getElementById("m");
var m_ctx = m_canvas.getContext("2d");
//紅方型
m_ctx.beginPath();
m_ctx.fillStyle="#f00";
m_ctx.fillRect(0,0,250,250);
//綠方型
m_ctx.fillStyle="#0f0";
m_ctx.fillRect(251,0,250,250);
//藍方型
m_ctx.fillStyle="#00f";
m_ctx.fillRect(0,251,250,250);
//灰方型
m_ctx.fillStyle="#666";
m_ctx.fillRect(251,251,250,250);
//橘圓
m_ctx.arc(250, 250, 230, 0, Math.PI*2, true);
m_ctx.fillStyle = "#ff7800";
m_ctx.fill();
//黑圓
m_ctx.beginPath();
m_ctx.arc(250, 250, 100, 0, (Math.PI / 180) * 360, true);
m_ctx.fillStyle = "rgb(0,0,0)";
m_ctx.fill();
}
</script>
</head>
<body onload="draw_m()">
<canvas id="m" width="500" height="500"></canvas>
</body>
</html>
- 輸出畫面
-
原始碼
<!DOCTYPE html>
<html lang="en">
<head>
<meta charset="UTF-8">
<meta name="viewport" content="width=device-width, initial-scale=1.0">
<meta http-equiv="X-UA-Compatible" content="ie=edge">
<title>Document</title>
<script>
function draw_m() {
var m_canvas = document.getElementById("m");
var m_ctx = m_canvas.getContext("2d");
//紅方型
m_ctx.beginPath();
m_ctx.fillStyle="#f00";
m_ctx.fillRect(0,0,250,250);
//綠方型
m_ctx.fillStyle="#0f0";
m_ctx.fillRect(251,0,250,250);
//藍方型
m_ctx.fillStyle="#00f";
m_ctx.fillRect(0,251,250,250);
//灰方型
m_ctx.fillStyle="#666";
m_ctx.fillRect(251,251,250,250);
m_ctx.globalAlpha=0.5;
//橘圓
m_ctx.arc(250, 250, 230, 0, Math.PI*2, true);
m_ctx.fillStyle = "#ff7800";
m_ctx.fill();
//黑圓
m_ctx.beginPath();
m_ctx.arc(250, 250, 100, 0, (Math.PI / 180) * 360, true);
m_ctx.fillStyle = "rgb(0,0,0)";
m_ctx.fill();
}
</script>
</head>
<body onload="draw_m()">
<canvas id="m" width="500" height="500"></canvas>
</body>
</html>
-
- 輸出畫面
-
-
- 原始碼
-
<!DOCTYPE html>
<html lang="en">
<head>
<meta charset="UTF-8">
<meta name="viewport" content="width=device-width, initial-scale=1.0">
<meta http-equiv="X-UA-Compatible" content="ie=edge">
<title>Document</title>
<script>
function draw_m() {
var m_canvas = document.getElementById("m");
var m_ctx = m_canvas.getContext("2d");
//紅方型
m_ctx.beginPath();
m_ctx.fillStyle="#f00";
m_ctx.fillRect(0,0,250,250);
//綠方型
m_ctx.fillStyle="#0f0";
m_ctx.fillRect(251,0,250,250);
//藍方型
m_ctx.fillStyle="#00f";
m_ctx.fillRect(0,251,250,250);
//灰方型
m_ctx.fillStyle="#666";
m_ctx.fillRect(251,251,250,250);
m_ctx.globalAlpha=0.5;
//橘圓
m_ctx.arc(250, 250, 230, 0, Math.PI*2, true);
m_ctx.fillStyle = "#ff7800";
m_ctx.fill();
m_ctx.globalAlpha=1.0;
//黑圓
m_ctx.beginPath();
m_ctx.arc(250, 250, 100, 0, (Math.PI / 180) * 360, true);
m_ctx.fillStyle = "rgb(0,0,0)";
m_ctx.fill();
}
</script>
</head>
<body onload="draw_m()">
<canvas id="m" width="500" height="500"></canvas>
</body>
</html>
- 輸出畫面
-
-
-
-
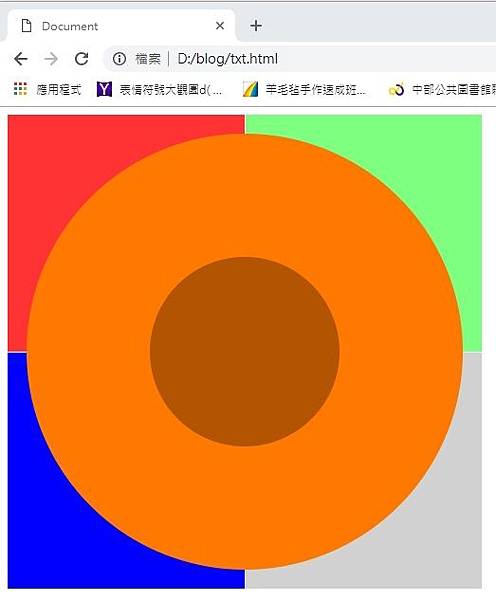
- .rgba 函數
- 如果要把圖形設定各種不同的透明度,則在 fillStyle 或 strokeStyle 裡指定顏色數值時,用 rgb 代替 rgba 即可以追加透明度數值
-
-
- 原始碼
-
<!DOCTYPE html>
<html lang="en">
<head>
<meta charset="UTF-8">
<meta name="viewport" content="width=device-width, initial-scale=1.0">
<meta http-equiv="X-UA-Compatible" content="ie=edge">
<title>Document</title>
<script>
function draw_m() {
var m_canvas = document.getElementById("m");
var m_ctx = m_canvas.getContext("2d");
//紅方型
m_ctx.beginPath();
m_ctx.fillStyle="rgba(255,0,0,0.8)";
m_ctx.fillRect(0,0,250,250);
//綠方型
m_ctx.fillStyle="rgba(0,255,0,0.5)";
m_ctx.fillRect(251,0,250,250);
//藍方型
m_ctx.fillStyle="#00f";
m_ctx.fillRect(0,251,250,250);
//灰方型
m_ctx.fillStyle="rgba(102,102,102,0.3)";
m_ctx.fillRect(251,251,250,250);
//橘圓
m_ctx.arc(250, 250, 230, 0, Math.PI*2, true);
m_ctx.fillStyle = "#ff7800";
m_ctx.fill();
//黑圓
m_ctx.beginPath();
m_ctx.arc(250, 250, 100, 0, (Math.PI / 180) * 360, true);
m_ctx.fillStyle = "rgb(0,0,0,0.3)";
m_ctx.fill();
}
</script>
</head>
<body onload="draw_m()">
<canvas id="m" width="500" height="500"></canvas>
</body>
</html>
- 輸出畫面
-
-
-
樣式- 漸層
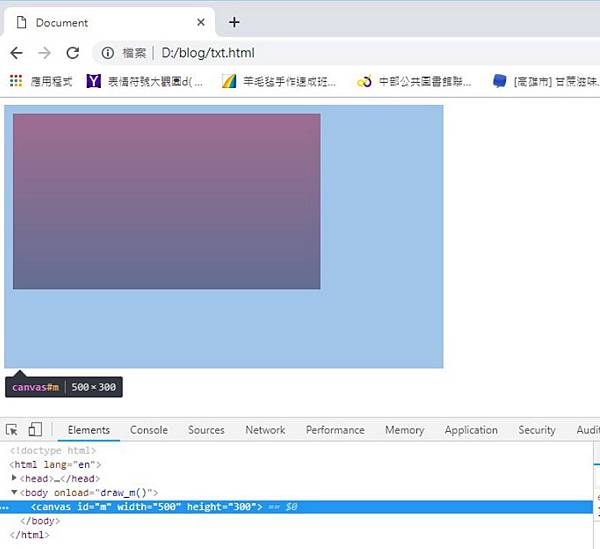
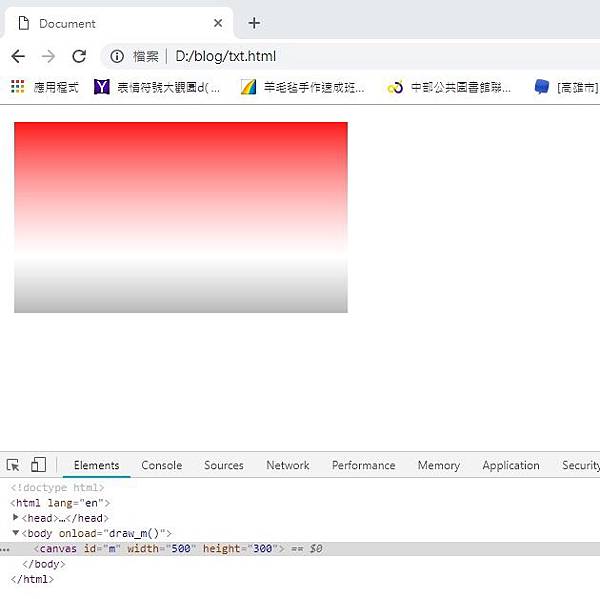
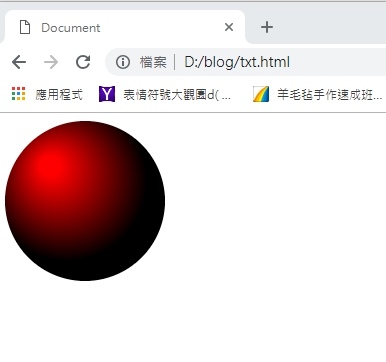
HTML5的漸層 可以選擇 線性漸層 和 放射性漸層
createLinearGradient(x1,y1,x2,y2) 線性漸層,指定起點 (x1,y1) 和 終點(x2,y2) 的漸層區域
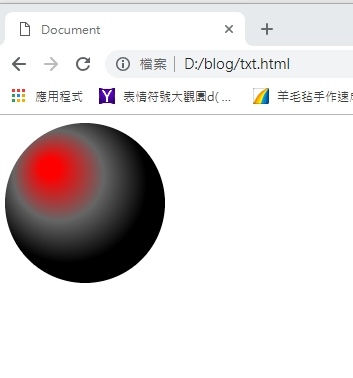
creatReadialGradient(x1,x2,r1,x2,y2,r2) 放射性漸層,以起點 (x1,y1) 為中心畫半徑 r1 圓形 和 以 (x2,y2) 為中心點畫半徑 r2 的圓形,畫出 2 個圓
assColoreStop(position,color) 漸層中新增顏色,position 是指漸層中色彩間的相對位置,數值介於 0.0 ~ 1.0 間,只要指定之間顏色就會自動計算出來做出漸層。
原始碼
<!DOCTYPE html>
<html lang="en">
<head>
<meta charset="UTF-8">
<meta name="viewport" content="width=device-width, initial-scale=1.0">
<meta http-equiv="X-UA-Compatible" content="ie=edge">
<title>Document</title>
<script>
function draw_m() {
var m_canvas = document.getElementById("m");
var m_ctx = m_canvas.getContext("2d");
var grad = m_ctx.createLinearGradient(0,0,0,300);
grad.addColorStop(0,'#f00');
grad.addColorStop(1,'black');
m_ctx.fillStyle = grad;
m_ctx.fillRect(10,10,350,200);
}
</script>
</head>
<body onload="draw_m()">
<canvas id="m" width="500" height="300"></canvas>
</body>
</html>
輸出畫面:
原始碼
<!DOCTYPE html>
<html lang="en">
<head>
<meta charset="UTF-8">
<meta name="viewport" content="width=device-width, initial-scale=1.0">
<meta http-equiv="X-UA-Compatible" content="ie=edge">
<title>Document</title>
<script>
function draw_m() {
var m_canvas = document.getElementById("m");
var m_ctx = m_canvas.getContext("2d");
var grad = m_ctx.createLinearGradient(0,0,0,300);
grad.addColorStop(0,'#f00');
grad.addColorStop(0.5,'rgba(255,255,255,0.5)');
grad.addColorStop(1,'black');
m_ctx.fillStyle = grad;
m_ctx.fillRect(10,10,350,200);
}
</script>
</head>
<body onload="draw_m()">
<canvas id="m" width="500" height="300"></canvas>
</body>
</html>
輸出畫面
原始碼
<!DOCTYPE html>
<html lang="en">
<head>
<meta charset="UTF-8">
<meta name="viewport" content="width=device-width, initial-scale=1.0">
<meta http-equiv="X-UA-Compatible" content="ie=edge">
<title>Document</title>
<script>
function draw_m() {
var m_canvas = document.getElementById("m");
var m_ctx = m_canvas.getContext("2d");
var grad = m_ctx.createRadialGradient(45,45,10,62,60,80);
grad.addColorStop(0,'#f00');
grad.addColorStop(1,'black');
m_ctx.fillStyle = grad;
m_ctx.arc(80,80,80,0,Math.PI*2,true);
m_ctx.fill();
}
</script>
</head>
<body onload="draw_m()">
<canvas id="m" width="500" height="300"></canvas>
</body>
</html>
輸出畫面
原始碼
<!DOCTYPE html>
<html lang="en">
<head>
<meta charset="UTF-8">
<meta name="viewport" content="width=device-width, initial-scale=1.0">
<meta http-equiv="X-UA-Compatible" content="ie=edge">
<title>Document</title>
<script>
function draw_m() {
var m_canvas = document.getElementById("m");
var m_ctx = m_canvas.getContext("2d");
var grad = m_ctx.createRadialGradient(45,45,10,62,60,80);
grad.addColorStop(0,'#f00');
grad.addColorStop(0.5,'#666');
grad.addColorStop(1,'black');
m_ctx.fillStyle = grad;
m_ctx.arc(80,80,80,0,Math.PI*2,true);
m_ctx.fill();
}
</script>
</head>
<body onload="draw_m()">
<canvas id="m" width="500" height="300"></canvas>
</body>
</html>
輸出畫面
樣式- 線條樣式
原始碼
<!DOCTYPE html>
<html lang="en">
<head>
<meta charset="UTF-8">
<meta name="viewport" content="width=device-width, initial-scale=1.0">
<meta http-equiv="X-UA-Compatible" content="ie=edge">
<title>Document</title>
<script>
function draw_m() {
var m_canvas = document.getElementById("m");
var m_ctx = m_canvas.getContext("2d");
m_ctx.strokeStyle="#f00";
m_ctx.lineWidth=15;
// 上線
m_ctx.beginPath();
m_ctx.lineCap="butt";
m_ctx.moveTo(10,10);
m_ctx.lineTo(150,10);
m_ctx.stroke();
// 中線
m_ctx.beginPath();
m_ctx.lineCap="round";
m_ctx.moveTo(10,80);
m_ctx.lineTo(150,80);
m_ctx.stroke();
// 下線
m_ctx.beginPath();
m_ctx.lineCap="square";
m_ctx.moveTo(10,150);
m_ctx.lineTo(150,150);
m_ctx.stroke();
}
</script>
</head>
<body onload="draw_m()">
<canvas id="m" width="500" height="300"></canvas>
</body>
</html>
輸出畫面
說明:
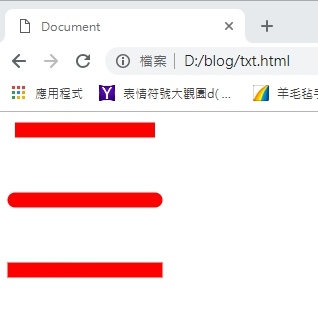
lineWidth=15; 線條寬度,預設值為 1.0
lineCap=type; 線條二端收尾樣式,預設值於 butt
butt:預設,不做任何效果
round:把線條寬度的 1/2 做半徑做出半圓,畫在線二端
square:線條二端呈現四方形,高度是線條寬度的 1/2


 留言列表
留言列表
